Journal club - Modeling the cell cycle – Just Timing
Cell cycle is an orchestration of colossal molecules in the elaborate cell machine. Analogous to the central theorem, genetic code to protein expression and phenotypes as molecular interactions to cell cycle progression, which means there can be two kinds of studies that meat each halfway:
- Study of protein interaction dynamics during the cell cycle - to discuss how certain group of proteins contribute to an overall function. For example, Nurse group, 2016 has provided proteomic evidence about the dependence of driving kinase - substrate interaction on substrate activity.
- Study of cell cycle progression kinetics - to characterize key events (checkpoints, commitment points, etc.) and predict the existence of functional proteins.
If we are able to establish a working cell cycle model based on defined protein interactions, then we are confident that we have interpreted the protein function correctly. If the model cannot capture cell cycle features, commonly the case, a refinement of the model with more parameters, different kinetic formulas i.e., modelling approaches may reveal undiscovered features. However, a formula with unresolved biological meaning is exposed to critics (e.g. over-fitting).
A recent research has concluded unique DNA damage response kinetics in consecutive cell cycle phases (G1, S and G2/M) through modeling the time length of these phases. Two questions haunted me when reading through the paper:
- How to characterize various differences concluded in a more statistical way? What are true differences and what can be artifacts.
- How can we fathom the biological nature of model parameters?
Binomial, Poisson, Exponential and Gamma distribution
Just as the organization of four cell cycle phases, each phase is viewed as a combination of $k$ sub-steps. Each sub-step posses a binary outcome: succeed or fail to progress into next step. The intrinsic kinetics of the phases, perturbation of the cell cycle manifests as the variance of time taken by these steps. Hence, cell cycle phases are modeled as a Poisson process, an extension of Binomial distribution with regard of time.
The probability of obtaining $n$ binary outcomes (number of success) from $n$ Bernoulli trials follows Binomial distribution is
Let’s consider number of success within unit time. If we are able to perform as many trails as possible within unit time, our result will be close to the expectation $pn$. Distribution of number of success within time T will be a Poisson distribution
where $\lambda_T = pn$, an estimated number of success within time T, a.k.a, arrival rate (imaging cars arriving the toll gate on the highway).
In essence, Poisson process describes the increase of number of success within certain time interval $t$. By simply replacing $\lambda_T$ with $\lambda * t$
It can be deduced that time taken for the cell to progress from $k_i$ to $k_{i+1}$ follows Exponential distribution
Note: discrete $k$ corresponding to probability mass function while continuous $t$ to probability density function.
To aggregate all $k$ steps together; time taken by the whole phase can be modeled with Gamma distribution
where $k$ is known as the shape parameter and $\theta$ is the scale parameter. Importantly, $\theta = \frac{1}{\lambda}$ as in exponential distribution.
Note: $\frac{1}{\theta} = \lambda$ is also known as the rate parameter $\beta$ in combination with the shape parameter $\alpha = k$.
Useful links
- Explanation of the entire logic chain
- Deduction from exponential to gamma
- Gamma distribution and its parameters
A basic cell cycle time model in response to DNA damage
In the primarily model suggested by the research, DNA damage induced by neocarzinostatin (NCS) is regarded as an intermediate event that does not have long-lasting effects. As described, cells either arrest for a while: $t_{halt} \sim Gaussian(\mu, \mu/3)$, or exit the cell cycle with the probability $p$ after NCS treatment. The cell cycle stage of a cell in the asynchronous population is indicated by the fraction parameter $f \sim Uniform(0,1)$. The overall time of cell cycle is estimated by Gamma distribution as discussed above. The post-damage time is given as where $k$, $\lambda$, $\mu$ and $p$ are cell cycle phase-dependent parameters and therefore estimated.
Note: Viewing drug adminstration as a single event is the main weak point of the study. This inevitable foible when experimenting with drugs can make kinetics or LOF studies less predictable. Therefore, a shape, switch-like manipulation is desirable (e.g. auxin-inducible degron system (AID)).
Model refinement
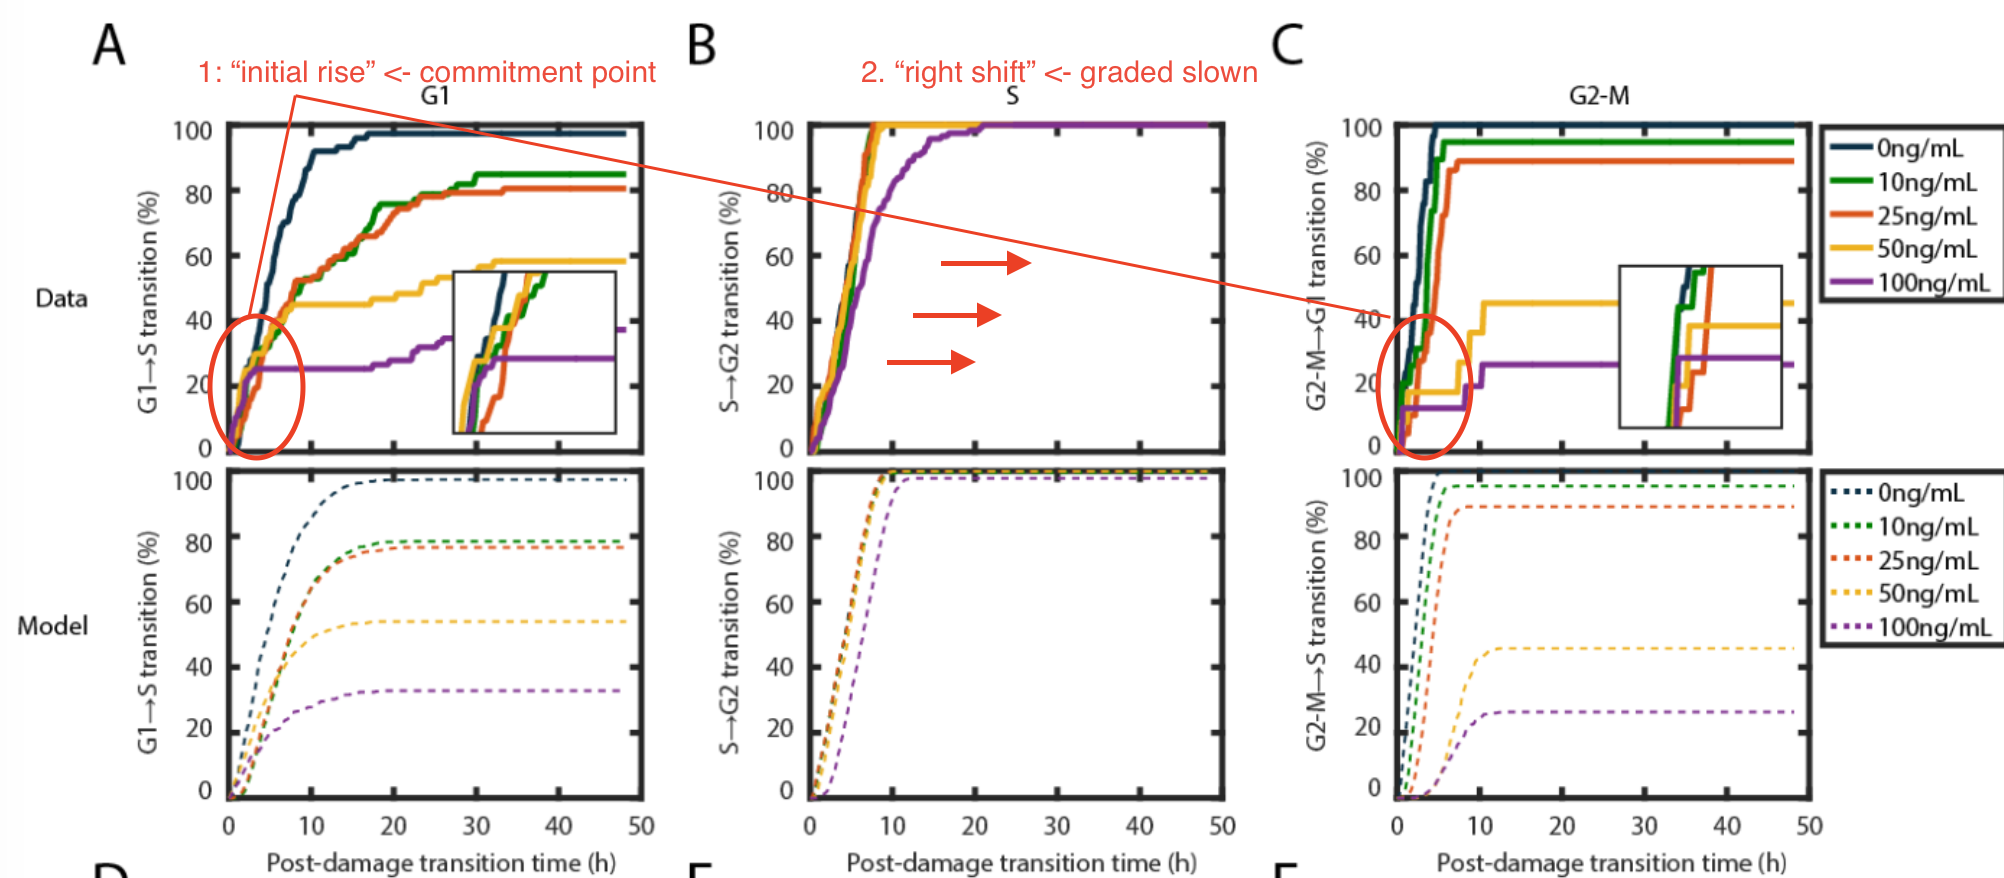
The figure below taken from the manuscript shows two discrepancies between model fitting (bottom) and the observation (two).
- In G1 and G2/M phases, the cumulative distribution curves representing NCS treatment at increasing level converges at first (the “initial rise”) and then diverges as predicted, which means there is always a population of cells escape from DNA damage response.
- In S phase, the prediction curve has a 50% right shift compared with the observation as claimed, indicating a slow-down kinetics instead of all-or-none halt.

Two rectifications of the model were made respectively
- For each phase, introduce the time point named commitment point $I_{cp}$. Cells that have already passed through this point show no response to DNA damage.
- For S phase, instead of modeling all-or-none arrest by $t_{halt}$, a slow-down kinetics is modeled by Gamma distribution with decreased rate parameter $\lambda$.
The ultimate model given by the study is
Conclusions & Comments
A bunch of important messages can be drawn by interpreting fitted model parameters in combination with biological evidence described in the paper.
- Cells undergo all-or-none arrest in G1/G2 when suffering from DNA damage, evidenced by switch-like cyclin/CDK activity mediated by various molecules
- DNA damage checkpoint in S phase is graded, evidenced by late-origin firing inhibition and dominant origin mechanism. It is inferred by the author that less-stringent S phase checkpoint allows cell to progress with replication mistakes and therefore indicating G2 is a better target for cell cycle-based therapy.
- G2 commitment point detected by the model is at the boundary between G2 and M (0.5h before M entry), which is more strict than G1 (3~4h before S entry). The nature of G2 commitment point may resides in an array of events happening around 0.5h before mitosis (e.g. positive feedback loop of cyclin B1/CDK1 translocation).
From my perspective, the discovery of commitment point in a computational flavour is more intriguing than two distinct kinetics. Table S2 & S3 of the paper only show little decrease (even increase in 6/10 cases) of model-observation-difference after applying graded-slow-down model to S phase, thus require more concrete, biological evidence. On the other hand, the recurrence of population that escape DNA damage is definitive. Overall, the paper demonstrates the complete logic of computational modeling, its application and interpretation that may spark the venture into much more biological natures.
References
Paper discussed
CHAO, H. X., POOVEY, C. E., PRIVETTE, A. A., GRANT, G. D., CHAO, H. Y., COOK, J. G. & PURVIS, J. E. (2017) Orchestration of DNA Damage Checkpoint Dynamics across the Human Cell Cycle. Cell Systems, 5(5), 445-459.e5.
Paper referred
Nurse group, 2016 SWAFFER, M. P., JONES, A. W., FLYNN, H. R., SNIJDERS, A. P. & NURSE, P. (2016) CDK Substrate Phosphorylation and Ordering the Cell Cycle. Cell, 167(7), 1750-1761.e16.
auxin-inducible degron system (AID) LI, S., PRASANNA, X., SALO, V. T., VATTULAINEN, I. & IKONEN, E. (2019) An efficient auxin-inducible degron system with low basal degradation in human cells. Nature Methods, 16(9), 866–869.
positive feedback loop of cyclin B1/CDK1 translocation SANTOS, S. D. M., WOLLMAN, R., MEYER, T. & FERRELL, J. E. (2012) Spatial positive feedback at the onset of mitosis. Cell, 149(7), 1500–1513.
